
 Kari Switala
Want a Website That Gets Results? Track These Key SEO Metrics
Part 2 of our Key Metrics Series Search Engine Optimization, or SEO, is a huge part of a successful website…so much so, that it deserves its own...

Part 1 of our Key Metrics Series
When you aren’t seeing results from your marketing, it can be easy to think you need to spend more money on your marketing efforts. In reality, you might just be using the wrong messaging or channel. Tracking key metrics helps you determine what’s working (and what isn’t) so you can make informed adjustments that lead to more effective marketing.
Key metrics, or key performance indicators (KPIs), are measurable values that help you determine how successful your marketing efforts have been. There are key metrics you can track across almost any platform you use — website, social media, email marketing, and so on. In this article, we’re focusing on website metrics.
Tracking key website metrics can provide you with useful information to help you build a better, more powerful site. These metrics can inform changes to your content strategy and website design to make your site more accessible and engaging, leading to more conversions.
Here are 10 key website metrics to keep an eye on.
 This is one of the first website metrics you should track. If you have too few visitors, many of the other metrics we’ll discuss won’t have much value. So first things first, you need to keep track of how many visitors your site is getting.
If you’re having trouble attracting visitors, there are a number of things you can do, such as:
Tip: Posting blog articles on a regular basis is a great way to drive more traffic to your website.
Once your site has a good visitor base, you should focus your traffic measurement on the number of return visitors you are getting. Having a high number of return visitors is important because it shows that your content is engaging enough to make people want to come back. Ideally, the percentage of return visitors to your site should be around 30%.
If your return visitor count is low, try to:
 While tracking the number of visitors to your website is important, ultimately there is no set number to shoot for. Instead, what you want to work toward is an increase in traffic over time.
A steady increase in website traffic is an indicator that your digital marketing strategies are performing well.
To track your increase in traffic and spur continued increases, do the following:
 The websites, social media platforms, email newsletters, search engines, and other places on the internet that drive people to visit your website are considered your traffic sources.
Tracking the top sources of traffic to your site helps you understand your audience better. This is especially true when you combine that information with other data.
For example, say your website’s average session duration (another metric we’ll talk about later on) is 2 minutes. If you look more closely at the traffic sources associated with your session time data, you’ll find some great insight into the activity of your site visitors.
You might find, for instance, that the average session duration for visitors coming from Facebook is only about 30 seconds, but for those coming from your email newsletter it’s over 3 minutes. This tells you that your email newsletter subscribers enjoy browsing your website much more than visitors from Facebook.
Information like this can help you refine your content strategy to reach the audience that is most likely to engage with your website.
 In a similar vein, knowing what devices your website visitors are using can help you determine how to make your site more engaging.
In addition to knowing the top device types your visitors are using (desktop computer, tablet, or mobile phone), you can also track which operating systems (iOS, Android, Windows) and which web browsers (Chrome, Safari, Firefox) they are using.
Armed with this information, you will be better equipped to optimize your website for the devices and systems that most of your audience uses to access it. This will come in especially handy the next time you make updates to your site’s content or design.
 This metric tells you how much time visitors spend actively engaging with your website. The average website session duration time across all industries is 2-3 minutes.
Depending on the focus of your website, this metric could be extremely helpful…or not at all. If your site is focused on the products and services you sell and is dependent on people navigating through its pages and links, then session duration can be a great indicator of how engaging your website is.
But if your site is more focused on in-depth articles, long videos, or other long-form content, your visitors won’t click on as many pages or links. In this case, session duration isn’t a reliable way to measure your site’s engagement.
 Similarly, tracking the average time a visitor spends on a particular page of your website tells you how engaging that page is. This gives you insight into which kinds of pages your audience likes and wants to see more of.
The average time on page will vary, but across industries the average is around 52 seconds.
If your website is focused on content and is dependent on visitors reading articles or watching videos, this metric will be especially helpful to you. When you know which pages your website visitors are engaging with the most, you will know what types of content to create in the future.
This metric shows you exactly how many of your website’s pages a visitor has browsed. In essence, it tells you how interesting your website is to your audience.
It’s also a great indication of potential conversion. While a high average page views per session score doesn’t guarantee conversions, it’s a good indicator that you’re likely to have a high number of subscribers or customers
Tip: To improve your average pageviews per session, focus on creating great content that includes internal links.
Adding links to your other content within each article or web page directs people to click through to visit other pages and continue engaging with your website. The goal is to offer so much value in one article that when you link to other content on your site, readers assume it will contain equally valuable information. The more they find this to be true, the more they will see you as a resource and thought leader in your industry.
 Your search engine results page (SERP) ranking reflects where your website content ranks on the results page when a user searches for something relevant to your website. SERP ranking is one of the clearest indicators of how your website content is performing. If you show up within the top searches on Google, you’re doing something right.
Google snippets, or “#0 results,” are the holy grail of SERP ranking.
A Google snippet is the first result at the top of the search page, and it includes a longer snippet of the article rather than just the typical meta description. If your content makes it to this spot, you can officially say you’ve arrived!
Tip: To improve your chances of landing a Google snippet spot, include easily quoted sections in your articles, such as bulleted lists or callouts.
 Your site’s bounce rate is the percentage of website visits where a visitor only views one page before leaving your website. Bounce rate is heavily affected by the user experience of your site.
A visitor may leave for one of many reasons:
What makes a good bounce rate?
As a general rule:
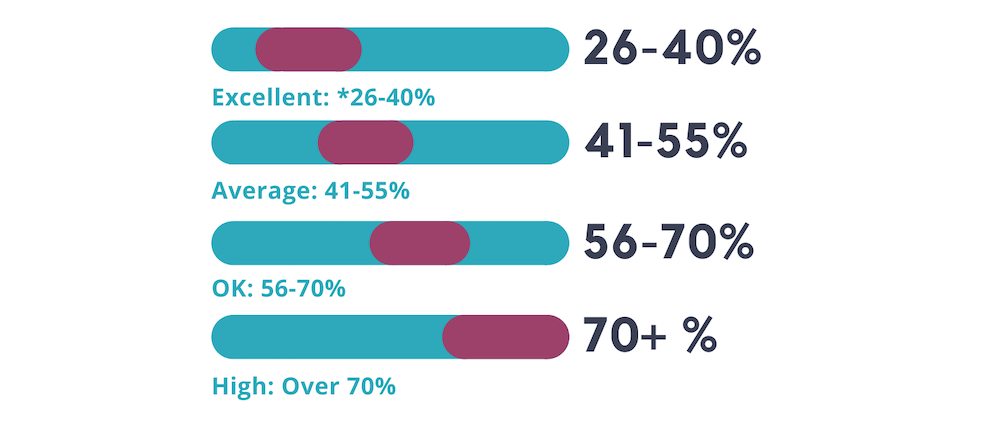
While the above is generally true, what is considered a good bounce rate will vary depending on the type of website you have. For an ecommerce site, the above rule stands — if users are leaving your site after only looking at one product, you have work to do.
But for a blog, a relatively high bounce rate is normal, and doesn’t necessarily signify that anything is wrong with your site.
If a well-written blog post provides what a user was looking for, there is no need for them to search the site further. This isn’t a negative thing at all — the user searched for a topic, found your blog, read it, and was satisfied with the information. In the blogging world, that’s a win!
Also, keep in mind the fact that mobile users are more likely to bounce in general, so if your site has high mobile traffic, your bounce rate may be higher as a result.
Since bounce rate varies so much between sites, it isn’t productive to compare your site’s rate to that of other websites, or even the “average.” The best thing you can do is to make note of your site’s current bounce rate and work to improve it.
To improve your bounce rate:
In general, when your website is fast, visually appealing, easy to navigate, and contains relevant information, visitors will want to spend more time there and your bounce rate will improve.
As you begin to track key metrics for your website, keep in mind that tracking changes over the course of time is more important than what your numbers look like at any given point. Regardless of how well (or how poorly) you are doing in any area, the goal is to continuously work toward improvement.
Tracking the same metrics over the course of several months will help you identify trends and determine if you are heading in the right direction or if it’s time to change course.
Need help creating a website strategy that will deliver optimum growth for your business? That’s where the team at Wild Fig Marketing comes in. Click below to schedule a Growth Strategy Session!


Part 2 of our Key Metrics Series Search Engine Optimization, or SEO, is a huge part of a successful website…so much so, that it deserves its own...
![How Often Should I Refresh the Content on My Website? [And Why Is It Important?]](https://www.wildfigmarketing.com/hubfs/bigstock-Technical-Support-Programming-460826949.jpg)
If it's been a while since you made updates to your website...it might be time.

Part 6 of our Key Metrics Series With its focus on visual content and younger target demographic, Instagram is Facebook’s hipper, more creative...