
 Jamie Beebe
Improve Your Facebook Ads With These 9 Key Metrics
Part 5 of our Key Metrics Series Facebook Ads have the potential to be powerful lead generation opportunities. They can boost the reach of your...
Part 6 of our Key Metrics Series
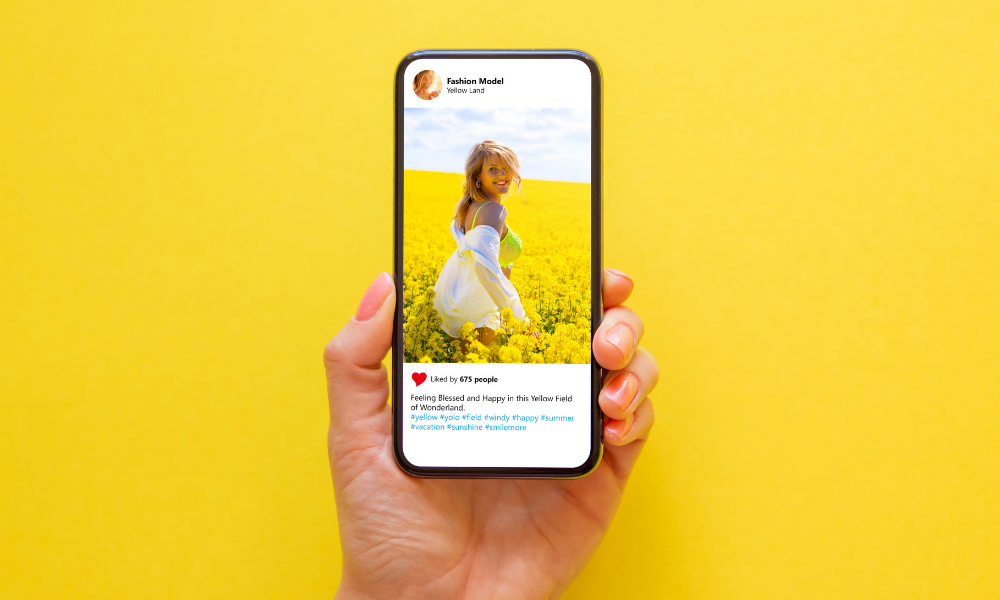
With its focus on visual content and younger target demographic, Instagram is Facebook’s hipper, more creative cousin.
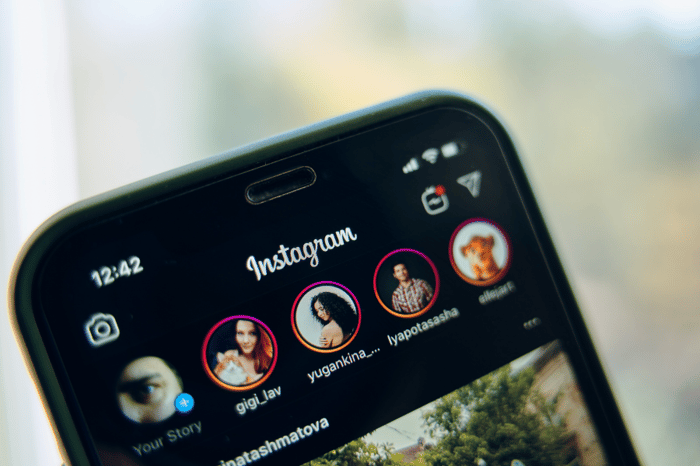
As a mobile-focused social media platform, Instagram can be viewed on a computer screen, but it only has full functionality on mobile. This is by design, as the vast majority of users are now engaging with social media platforms on their phones.
Aside from this, if there’s anything Instagram is known for, it’s engagement. This platform thrives on users being able to engage with a brand’s culture through photos, short videos, and stories.
If Instagram is part of your social media marketing strategy, you’ll want to track the following Instagram key metrics to keep an eye on your progress.
 Reach is one of the most important Instagram key metrics to track. It is often confused with impressions, so before we go further, let’s clear up any confusion:
Reach vs. Impressions:
In other words, impressions tell you how many views your posts have had, and reach shows you how many people you are reaching with your posts.
If your objective is to increase your brand awareness and reach a lot of people, you should focus on growing your reach.
To grow your reach:
 Engagement rate is the percentage of your followers who engage with your posts through likes, shares, comments, and saves. This metric is a key indicator of how well your audience is responding to your content.
Tracking your engagement rate over time will give you a sense of your overall performance trends.
Engagement rate is a better measure of engagement than the number of likes your posts get. If you have a smaller following, your posts won’t get as many likes, but if a large percentage of your followers are engaging with your posts, you’re still doing well.
To calculate engagement rate:
Engagement Rate = (Total number of engagements ÷ Follower count) x 100
This metric gives you an idea of what types of content most resonate with your audience. If your engagement rate is low, it could mean that your content isn’t resonating with your audience or that you aren’t posting during times when your followers are most active.
Try changing up your content or your posting time to bring your rate up.
Tip: Engagement rate isn’t always a helpful metric when it comes to video content because many people engage with a video simply by watching it — they don’t always hit that “like” or “share” button. For video, a metric like reach will be a more reliable gauge of your content’s success.
 Your follower count represents the potential reach of your content. Ideally, you want to see sustained, gradual growth in the number of people following your account — this indicates that people like what they see and want to see more of it.
Track your follower count over time, paying attention to when you get large spikes or drop offs in followers.
Look at what content you posted prior to those big changes to see what may have precipitated an increase or decrease in followers, and use this information to update your marketing strategy moving forward.
To view your follower growth, tap the “Insights” button on your Instagram profile page, then tap on “Total Followers”. There, you can see a chart showing the number of follows and unfollows as well as your overall growth. To change the time period of the chart, tap at the top left of the page where it says “last 7 days”.
Tip: Take your follower count with a grain of salt. While tracking growth can be helpful, the number of followers you have can fluctuate due to any number of reasons, so don’t get too hung up on that number. A smaller, but engaged, audience is more valuable than a large following with little engagement.
Users can save a post to view later by tapping the “bookmark” icon in the bottom right corner of a post. Tracking the number of saves your posts receive over time helps you determine which posts your audience finds the most valuable or helpful. You can then use this information when planning future content.
Tip: To improve your saves, post content your audience would be likely to save for future use, such as motivational quotes, tips, or how-tos.
 The number of comments your posts receive show you how engaging your content is. Comments (even negative ones!) give you the chance to interact directly with those who are following you and to build relationships with them.
Likes are easy to get. Often people will like a photo, then scroll past it without really reading the post. Comments indicate that not only are people reading your content, it has impacted them in some way. This type of engagement — especially when the comments are positive — is a huge part of building a loyal, engaged fan base.
Ideally, you want to post when your followers are most likely to engage with your content. Finding the best time to post isn’t difficult, but it does vary from account to account depending on your audience and what industry you are a part of.
To find the best time to post, go to your Instagram insights page, then tap on “Total Followers”. Scroll to the bottom of the page to the chart labeled “Most Active Times”.
You can view this chart by hours or days to determine which days and times your engagement has been highest. You can also change the time span of this chart at the top of the page (it defaults to the last 7 days).
Referral traffic indicates the number of people clicking through to your website from Instagram.
Tracking referral traffic from Instagram is a little trickier than with other social media platforms, because Instagram doesn’t allow clickable links in posts or comments. The only places you can include a clickable link are in your bio or in your stories.
It can be difficult to track referral traffic from a specific campaign, but one way to do this is by using UTM parameters. These are tags you can tack onto a URL that let Google Analytics (or other web analytics program) know exactly where the user referred from.
Even without UTM codes though, you can track how many website visitors are coming from Instagram in general by using Google Analytics.
 Stories are now an integral part of a successful Instagram marketing strategy. They provide another dimension of content for your audience, and give you more flexibility and freedom in what you post than in your feed, as stories disappear after 24 hours.
Stories are one of the best ways to strengthen your relationships with your followers.
Each individual story slide has its own metrics. Tracking your view count, taps forward, and taps back will give you an indication of what’s resonating with your audience and what isn’t.
When you have more than one slide to your stories, calculating the following metrics will show you how engaging your Instagram stories are to your audience.
Watch-through rate measures the percentage of people who watched your stories from beginning to end. To calculate this metric:
(Final story slide’s number of views ÷ First story slide’s number of views) x 100
Drop-off rate measures the percentage of people who drop off after your first story slide. You can calculate your drop-off rate like this:
(First story slide’s number of views ÷ Final story slide’s number of views) x 100
Completion rate measures the percentage of people who watch the entire length of a slide, rather than tapping ahead to the next one or exiting out. To calculate the completion rate of each slide:
(Number of impressions – Number of exits) ÷ Number of impressions
Calculating these metrics and tracking them over time will give you a benchmark from which to improve your Instagram stories engagement.
 Along with stories, Reels are now a huge part of increasing follower engagement. In fact, Instagram has started prioritizing video content over photos. So if you’re not yet posting Reels videos to your grid, it’s time to start.
If you are using Reels, here are a couple of key metrics to keep your eye on:
In addition, keep an eye on the number of Likes, Comments, Saves, and Shares your Reels get. These metrics are the same for Reels as they are for posts — see those sections above for more details.
To find your Reels metrics:
Alternatively, to see metrics for a specific Reel: open the Reel, tap the three dot icon on the bottom right of the screen, then tap insights.
We hope these Instagram key metrics help you better understand how effective your Instagram content is. Tracking the effectiveness of your posts, stories, and Reels will give you a better handle on what content to post to better engage your audience.
Want help boosting your engagement on Instagram? Outsource your marketing to Wild Fig! Schedule an exploratory call to talk about how we can help you be seen online.
Part 5 of our Key Metrics Series Facebook Ads have the potential to be powerful lead generation opportunities. They can boost the reach of your...

Are you taking advantage of everything social media has to offer your small business?

Part 4 of our Key Metrics Series Among all of the social media platforms out there, Facebook still rules when it comes to marketing. An active...