Improve Your Facebook Ads With These 9 Key Metrics
Part 5 of our Key Metrics Series Facebook Ads have the potential to be powerful lead generation opportunities. They can boost the reach of your...
5 min read
Kari Switala
:
March 4, 2022

Part 4 of our Key Metrics Series
Among all of the social media platforms out there, Facebook still rules when it comes to marketing. An active presence on Facebook helps you attract new customers and grow your business. But how do you know if the content you’re posting is gaining any traction? And why do some posts seem to do well, while others completely tank?
Facebook offers a ton of information on the performance of your posts, audience demographics, and more. To understand how well your content is performing on Facebook, keep an eye on the following key Facebook metrics.
(Note that Facebook Ads have a whole different set of metrics to track beyond the ones listed here…we’ll discuss Facebook Ads metrics in a future post.)
 The impressions metric tells you how many times your content has been seen. It is broken down into two categories:
To get the most out of this metric, it’s best to use it as a comparison tool, comparing your posts with one another over time. Look at your impressions over the course of a month or a quarter, watching for ups and downs as well as the overall direction your impressions are trending toward.
 Reach refers to the total number of people who have seen your post. Contrary to what you might think, just because someone follows your Facebook page doesn’t mean that they will always see your posts in their newsfeed. This is because Facebook has an algorithm-based feed:
Rather than displaying every post from every person and page a person follows, each person’s newsfeed will show the posts they are most likely to engage with.
Tracking your reach helps you understand what your audience likes and why certain posts perform better than others. And, like impressions, reach is split into two categories:
 Engagement is the percentage of people who saw your posts and interacted with them using likes, shares, clicks, or comments.
To improve engagement:
 The number of followers you have, in and of itself, doesn’t matter as much as whether or not your follower count is growing. Keep an eye on your growth by tracking not only how many new followers you get, but also how many followers you lost in the same period.
To attract new followers, try the following:
Understanding who your followers are and where they come from can help you customize your content to your followers’ needs and wants. Facebook allows you to track follower demographics like gender, age, and location (city, state, or country).
Tip: Notice what demographics make up the bulk of your followers, and direct most of your content to those demographics.
However, occasionally you may also want to create content that’s more attuned to other demographics. For instance, around a quarter of all Facebook users worldwide are between 18 and 24 years old, so it would make sense to occasionally direct content toward that demographic, even if the bulk of your followers skew older.
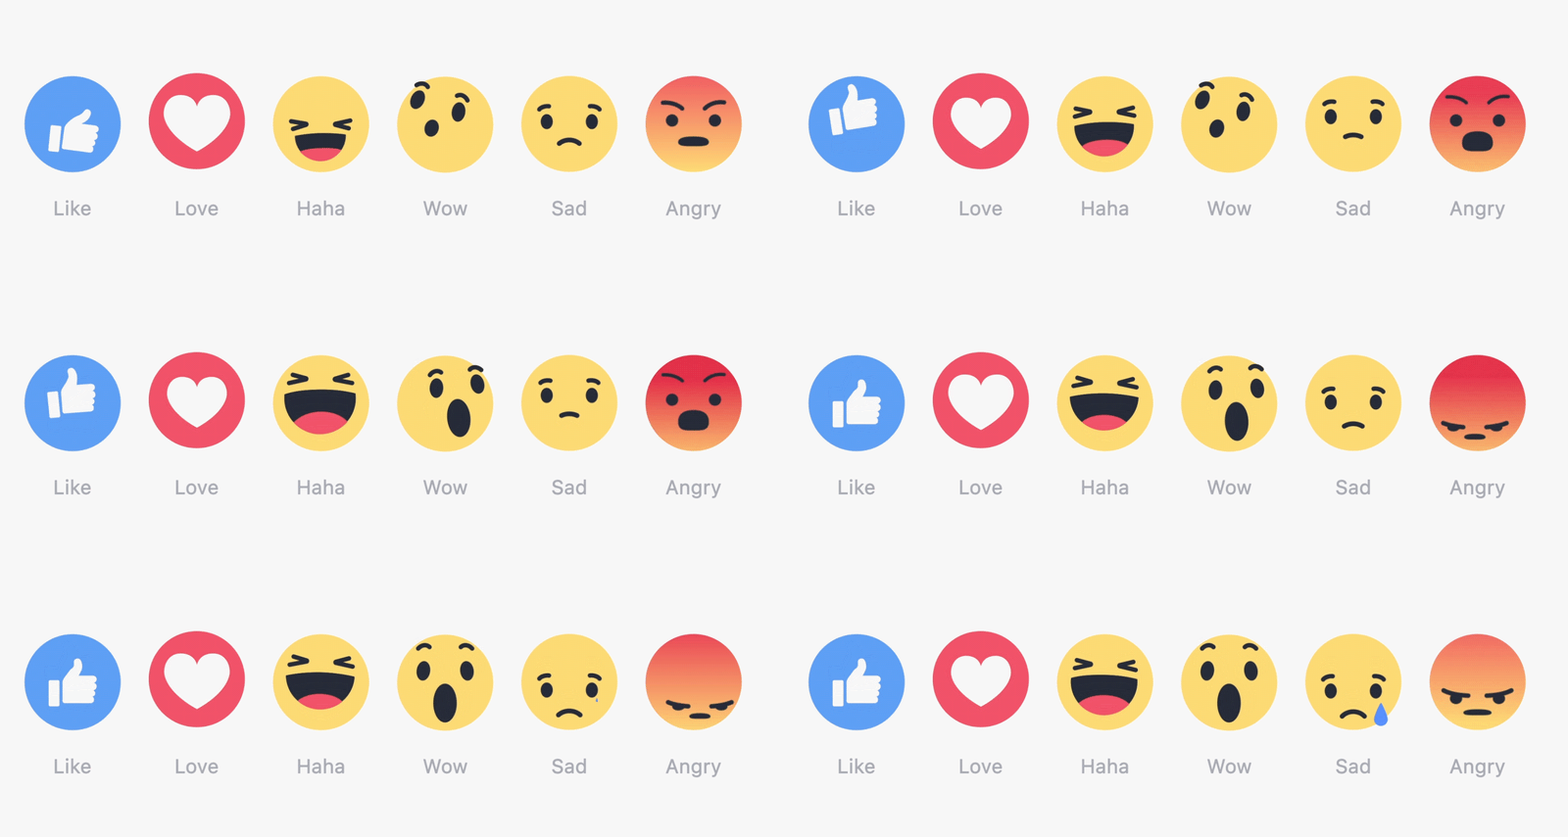
 The more reactions (likes, hearts, etc) your post has, the more people it will be shown to. To increase your post reactions:
When tracking post reactions, take them with a grain of salt — the number of reactions you get on each post can be affected by many factors, not only whether or not your followers enjoy the post.
Tip: If your reactions on a post seem low, check your reach and impressions for the post to see if they track with your typical numbers for those metrics.
Getting more reactions is great, but getting more comments on your posts is even better. Increase your post comments by:
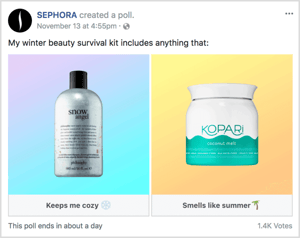
 Creating question posts. Invite followers to share their thoughts and opinions on your product or service, or to answer a question (a brand-related question or just something fun to get conversation rolling)
When people take the time to comment on your post, that’s a good sign that the content is something that interests them. Keep an eye on what kinds of posts people comment on the most, and use that information to inform your future posts.
 When your followers share your posts, it gives you the chance to reach more people and be seen by a bigger audience. You’ve likely heard of posts “going viral” — well, sharing is how that happens.
To increase shares:
Sharing has a domino effect: When viewers see that your post or article is being shared a lot, it’s a signal to them that your content has value, and they’re more likely to engage with it themselves.
Facebook CTR (also known in this case as “referral traffic”) is similar to the CTR we talked about in our key SEO metrics blog. When it comes to Facebook, your CTR tells you how many of the people who saw your content clicked through to your website.
You can calculate your Facebook CTR as follows:

Video is huge in today’s social media strategy, especially live video. Going live on Facebook allows you to connect with your followers in an interactive and engaging way. It is cost-effective, easy to use, and doesn’t require any production time. You don’t even need any special equipment to record live videos — your mobile phone will do.
If you’re not already using video to promote your business (live or previously recorded), consider adding it to your content mix. Even adding a monthly live video will do wonders for your overall Facebook engagement.
If you are using video, you’ll want to track a couple of key metrics specifically related to video:
Keeping track of these video metrics will help you see how many people are viewing and engaging with your videos, which videos are more popular than others, how much time people spend watching your videos, and so on. These details can be used to make your future video content more engaging for your followers.
Once you start tracking these key Facebook metrics, you’ll have a better idea of how well your content is doing. If you find that it’s not performing as well as you’d like, the team at Wild Fig Marketing can help. We can plan, write, and design engaging content, then post it to your business’ Facebook page for you.


Part 5 of our Key Metrics Series Facebook Ads have the potential to be powerful lead generation opportunities. They can boost the reach of your...

A Facebook business page can be a valuable business-growing tool. But like any tool, if you’re not sure how to use it correctly, it won’t be all that...
![How Often Should I Refresh the Content on My Website? [And Why Is It Important?]](https://www.wildfigmarketing.com/hubfs/bigstock-Technical-Support-Programming-460826949.jpg)
If it's been a while since you made updates to your website...it might be time.